Digital Marketing Dashboard Overview
Have you wanted to see how your marketing efforts are performing from within your Control Panel login without waiting for a report to be sent to you? Now you can!
Access the new Digital Marketing Dashboard to view:Â
- Website traffic and lead insights
- Google Ad campaign metrics
- Targeted Digital Advertising (TDA) metrics
- Social Advertising metrics
- Organic traffic insights
- Automated Email Marketing (AEM) resultsÂ
To access: Login to iCC, go to the Performance menu, then select Digital Marketing Dashboard
Digital Marketing Dashboard Details
Your dashboard will include data for all of your subscribed services including website plus any digital marketing services. If you do not subscribe to a digital marketing service we offer, you may still see some data in certain sections plus data for any of your subscribed services.  Â
Your dashboard includes the last full month as the default time selection. You can change to other previous date selections, but the current month data will not show completely until the current month is complete. The default comparison timeframe is the previous 30 days from the current previous month. Some comparison tools are available to allow you to change what you want to compare.
Reading the Dashboard
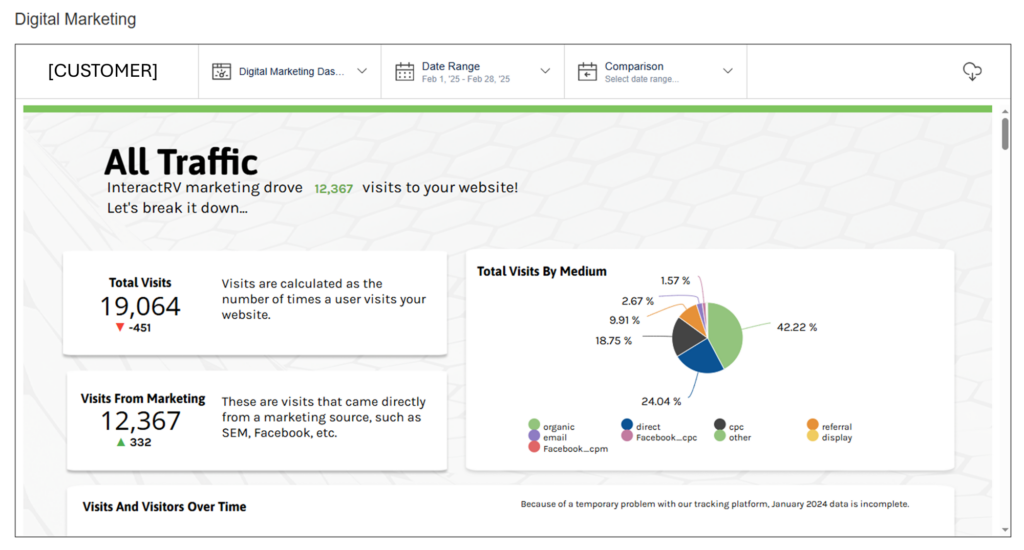
Website Traffic Insights
Use this section to see how much traffic is coming to your website, how many total visits your website is getting, how many unique visitors are in that data, what % of your traffic is coming from various sources, and how many visits are attributed to a marketing source.
- Total Visits with comparison
- Visits From Marketing with comparison
- Total Visits By Medium pie chart with percentage breakdown
- Visits and Visitors Over Time trend line chart showing last 6 months
Lead Insights
Use this section to learn how many leads you are getting from your website, how many of your website visits are generating a lead, what type of leads you’re receiving, and where those leads are coming from.  Â
- Total Leads with comparison
- Lead Conversion Rate with comparison
- Leads Over Time trend line chart showing last 6 months
- Leads By Type pie chart with percentage breakdown showing what type of leads
- Leads By Medium pie chart with percentage breakdown showing lead sources
Google Ads
Use this section to review key Google Advertising metrics such as how many visits were driven from Google Ads, Impressions, Clicks, Click-Through Rate (CTR), Conversions, Conversion Rate, and individual campaign performance metrics
- Visits driven by Google Ads campaigns
- Impressions with comparison
- Clicks with comparison
- Click-Through Rate with comparison
- Conversions with comparison
- Conversion Rate with comparison
- Individual Campaign data with comparison
- Impressions
- Clicks
- CTR (Click-Through Rate)
- Conversions
- Calls
- Form Fills
- CPC (Cost Per Click)
- CPM (Cost Per 1,000 impressions)
Targeted Digital Advertising
Use this section to review Targeted Digital Advertising (TDA) metrics such as store visits, impressions, clicks, click-through rate, leads, VDP views, and individual campaign performance metrics.  Â
Social Media Advertising
Use this section to see how many visits were driven by your Social Media ad campaigns as well as other channels you are participating in. Â Gain valuable insights into overall impressions, clicks, click-through rate, conversions, and conversion rate.Â
Organic Traffic
Use this section to see how SEO contributed to visits to your website. Look at key performance indicators like organic impressions, organic visits, organic leads, top landing pages, and top clicked organic searches.
Automated Email Marketing
Use this section to see how your automated email marketing service is performing, highlighting how many clicks AEM drove to your website. Key data here shows the quantity of total emails sent, unique clicks/total clicks, unique opens/total opens, handy percentage calculations of click-through rate and open rate. In addition, this section shows how many AEM leads were generated and how many price drop alert enrollments were captured. In the future, we are working to add a widget for the sales influenced by AEM. In this section you will also find a detailed report by type of email.
Glossary
At the end of the dashboard, there is a glossary of terms and abbreviations used throughout the dashboard that will help you understand and interpret this data.