Reading the Report
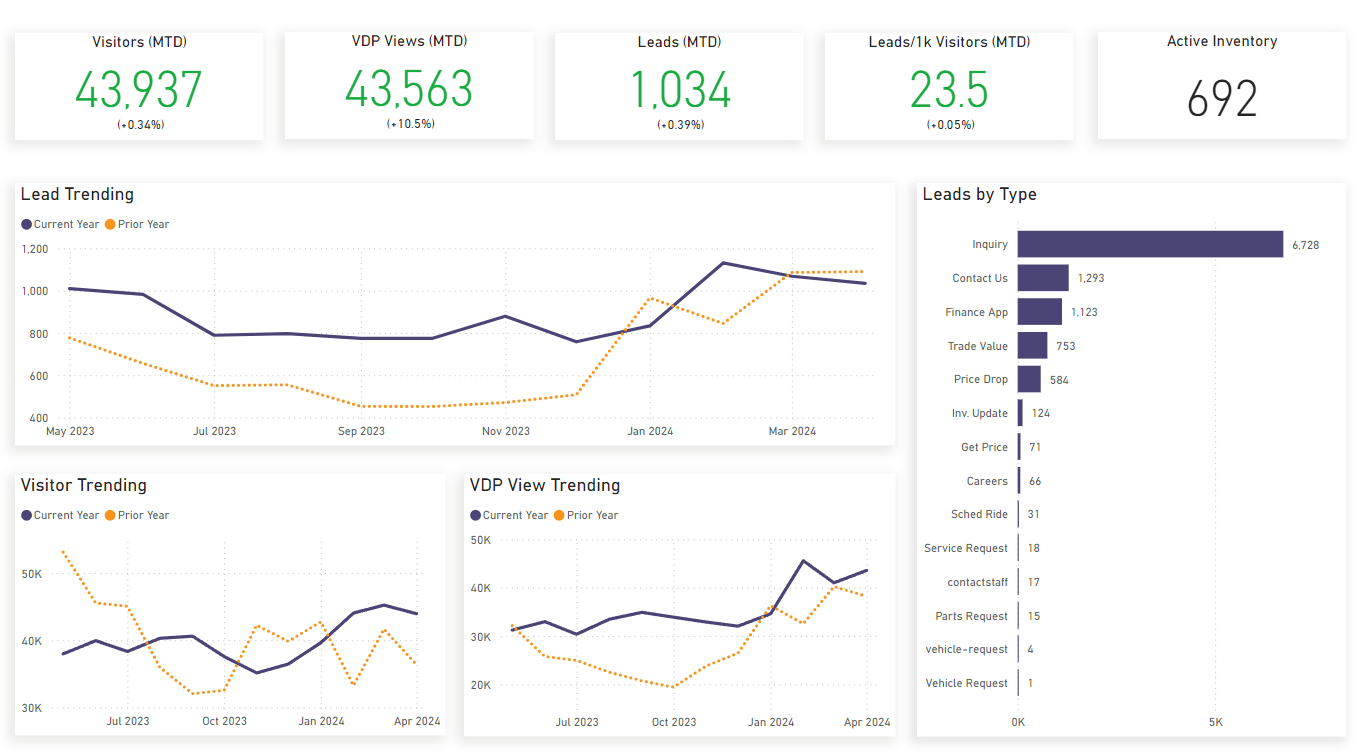
Key Metrics
- Visitors (MTD): Visitors this month
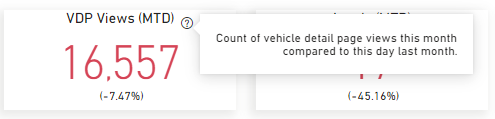
- VDP Views (MTD): VDP (Vehicle Display Page) views this month
- Leads (MTD): Leads this month
- Leads/1k Visitors (MTD): Leads per 1000 visitors this mont
- Active Inventory: Available inventory listings for website
Charts
Three charts on the bottom left display Leads, Visitors, and VDP (Vehicle Display Page) View comparisons for the current and previous year. The chart on the right displays lead generation breakdowns for each type of form on your site.
Tips
You can see more information about the metrics at the top of the screen by hovering over them and clicking the ? icon:
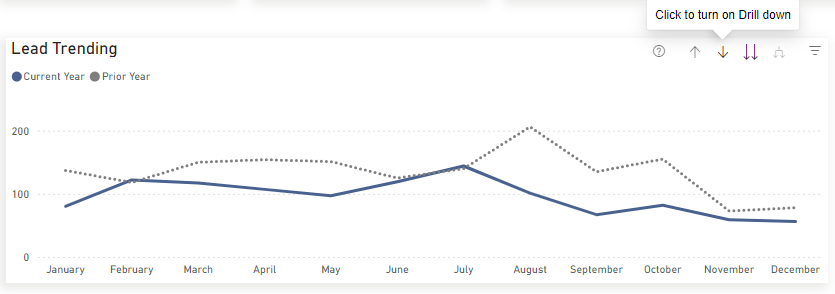
You can hover over the line charts to see specific numbers for individual months:
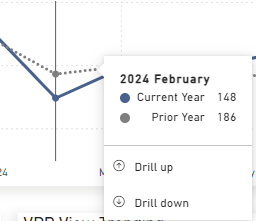
To see day-by-day information for a given month, hover over one of the line charts and click on the ↓ icon. This will activate Drill Mode. Then click on a month on the chart to drill into it. You can click the ↑ icon to return to month-by-month view: